Step-by-step webpages:
Code samples: - full code in HTM-pages and .js-files.
Result images, snapshots:
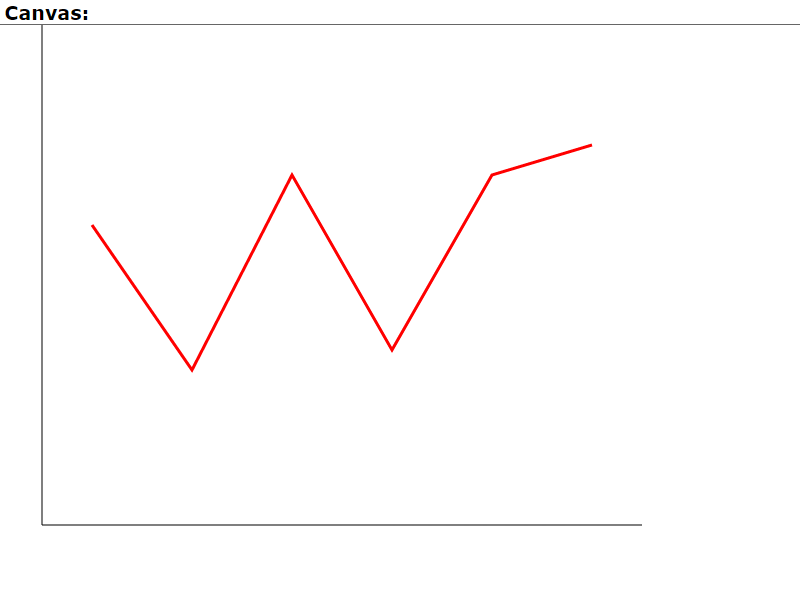
Plots a fixed time-series, and x,y-axis
Also adds some text in a td-box.
Script is in the HTML-file!
In JS:
var canv = document.getElementById('canvas_chart');
var c = canv.getContext('2d');
To plot a line: c.beginPath();
c.moveTo(x[0],y[0]);
for (var it=1; it<x.length; it++) c.lineTo(x[it],y[it]);
c.stroke(); //performs the plotting
Statistical data must be scaled, here with ymax.
Since canvas has y=0 at top:
ypix = gBox.H - y[it]/ymax * gBox.H;
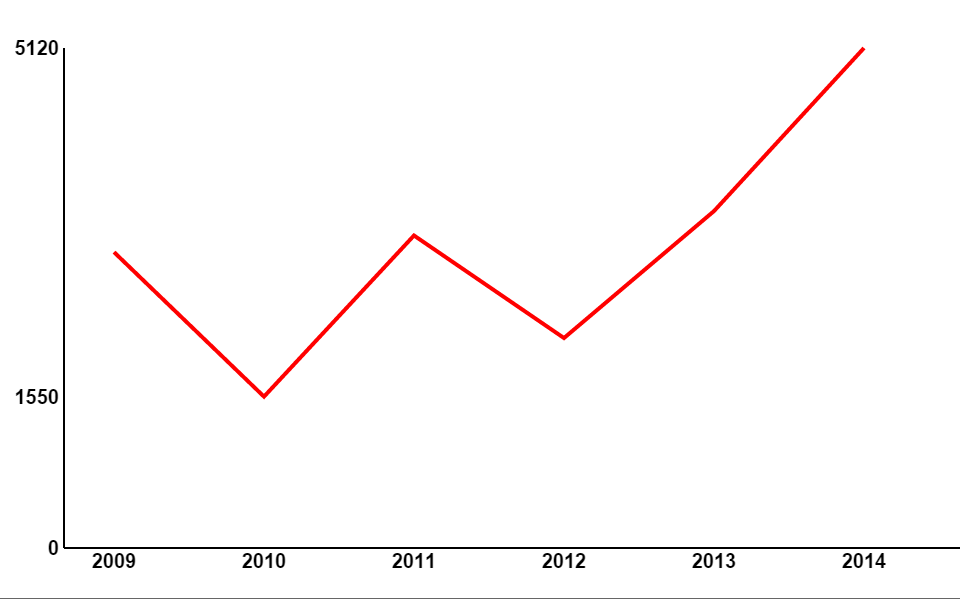
Add text to y-axis and x-axis
(One might use c.transform to invert y-axis,
but it also puts texts upside-down!)
xpix = gBox.x0 + it * gW/(Nx-1);
ypix = gBox.height+gBox.padding - y[it]/ymax*gBox.H;
c.lineTo(xpix,ypix);
str=ymax; c.fillText( str, x, y, maxLen);
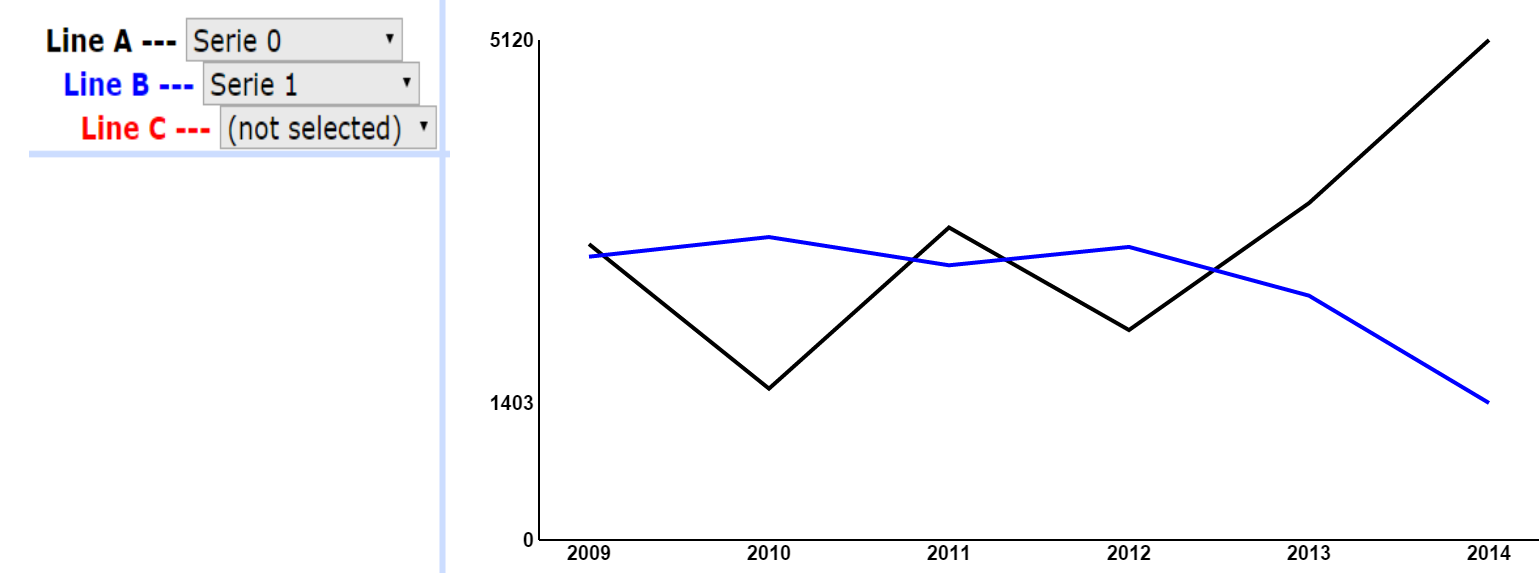
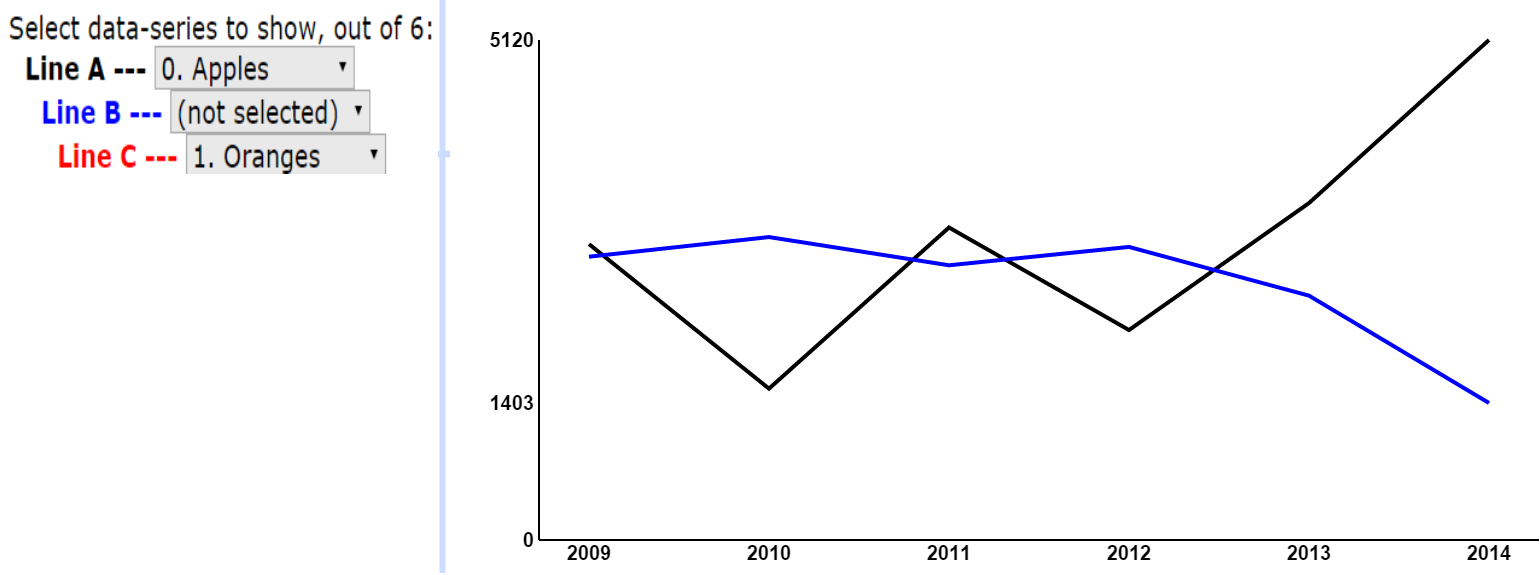
Several data-series. Plot 1..3 of them: lineA,B,C.
Use HTML select list.
NEW3: func. getDataValues, and
compStat which returs a stat-object.
<option value="x">(not selected)</option>
<option value="0" selected>Serie 0 </option> etc. Series 0,1,2,..
In JS:
function selChanged( el ) {
selInd = el.selectedIndex;
and then plot the selected: yarr[selInd][it]
Program and data put in .js-files
select-option filled from data yNames[.]
NEW4: function fillFormSelects, addOption,
initFormSelects.
Now a generic program! - only switch data-file!
<script src="app_pgm.js"> <script>
<script src="app_data.js"> <script>
Data as JS arrays:
var xarr = [ '2009', '2010', '2011', '2012', '2013', '2014' ];
var yNames = [ '0. Apples', '1. Oranges', '2. Lemons',... ];
var yarr = [
[ 3030, 1550, 3200, 2150, 3450, 5120 ], // =yarr[0][it]
[ 2901, 3102, 2813, 3001, 2502, 1403 ], // =yarr[1][it]
... ];
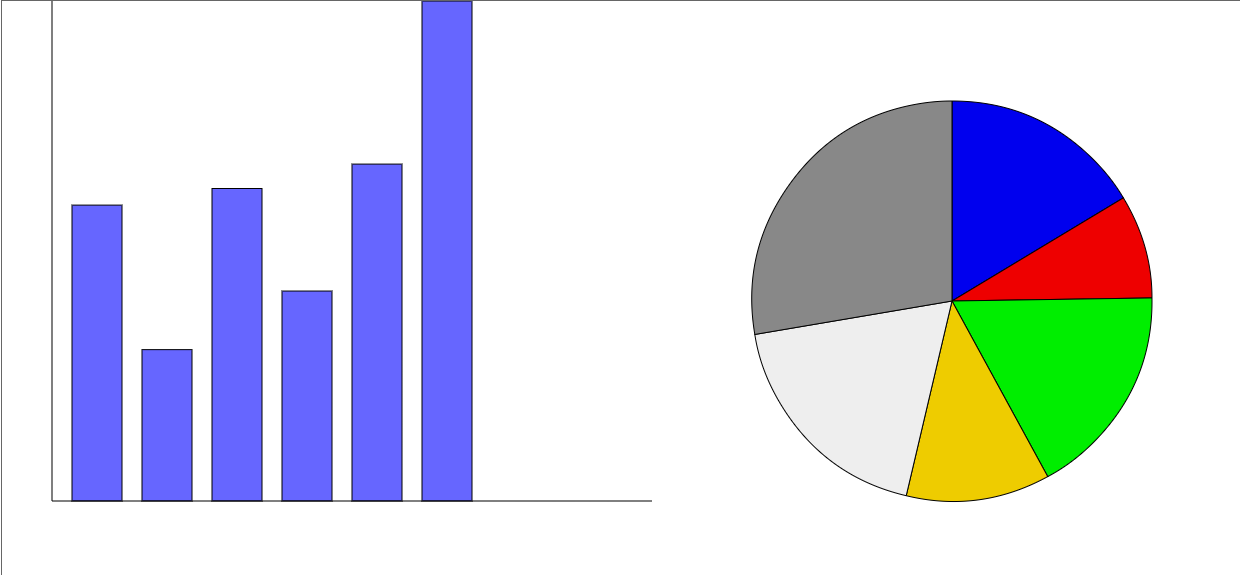
How to plot Bars and Pies with HTML5 canvas.
Useable functions: plotBars, plotPie.
See also: • Maps with Pie charts
c.fillRect( x, y, W, H); // x,y top-left corner.
c.strokeRect( x, y, W, H ); // border-line
Pies: Somewhat tricky loop over sectors
Begin with rad1 = -PI/2 (for start at 12 o'clock) then in step i :
c.moveTo(x0,y0); // pie center
rad2 = rad1 + (yarr[i] / ysum) * PI*2;
c.arc( x0, y0, r, rad1, rad2, false); //'false' for clock-wise!
c.closePath(); rad1=rad2;
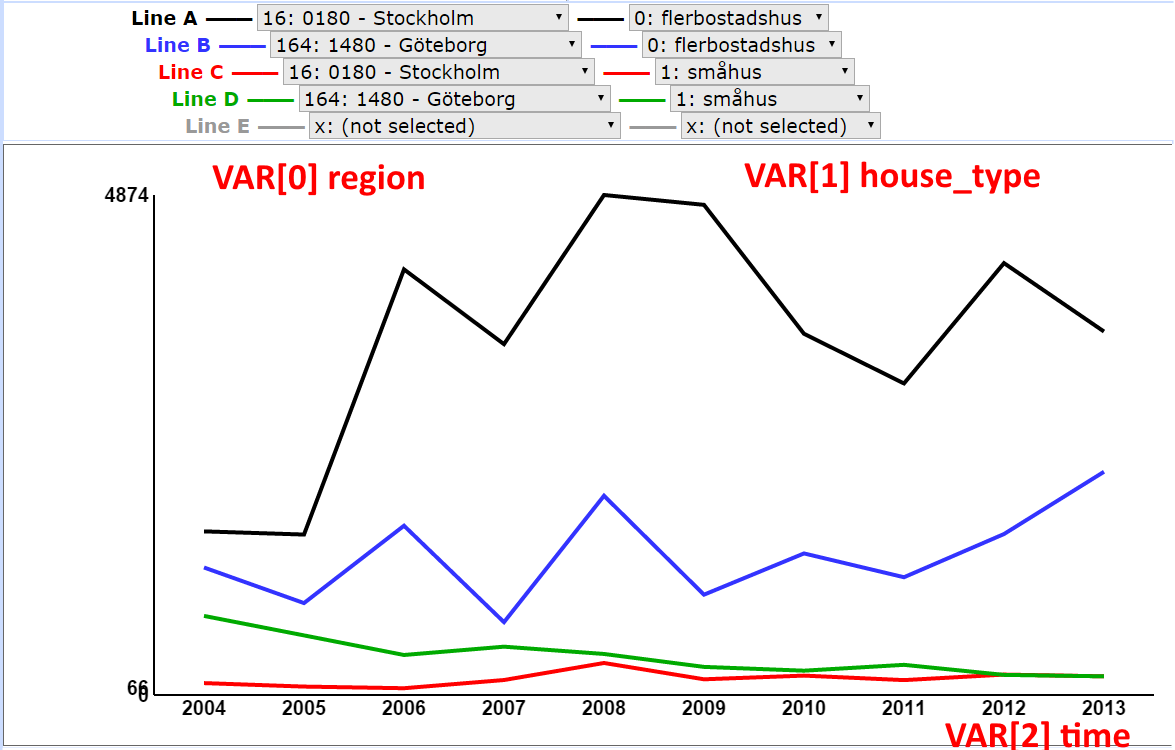
The PC-Axis system is used by many statistical offices. It delivers data in PX file format, which with some small canges can be put into javascript vars and arrays, and then used in apps.
- Conversion program: px2js.exe
NEW5: fillFormSelects, getDataValues for px.js-files.
• More on PX.JS-files and px2js program
Some px.js code:
CONTENTS="Building of new dwellings";
VAR[0].NAME="region"; VAR[1].NAME="house type"; VAR[2].NAME="year";
VAR[0].VALUES=["Stockholm","Gothenburg",....];
VAR[0].CODES=["0180","1480",....]; etc. for VAR[1], VAR[2]
DATA=[1595, 1564, 4149,... ]; // can be a very long array.
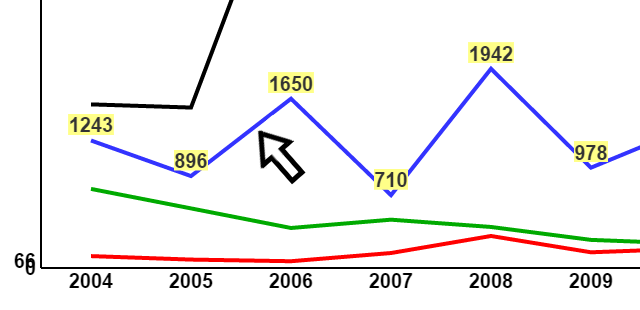
Shows time-series values, when mouse is over.
Uses: var mouse = mousePos(ev, canv);
c.isPointInPath( mouse.x, mouse.y );
<canvas id="canvas_chart" onmousemove="appTooltip(event);"..
In JS:
function appTooltip(ev)
Draw a polygon around each time-series: ypix[i]+10, ypix[i]-10
isOn = isPointInPath( mouse.x, mouse.y );
Text-values with fillText( yval, xpix, ypix );
Erase by drawing all again!
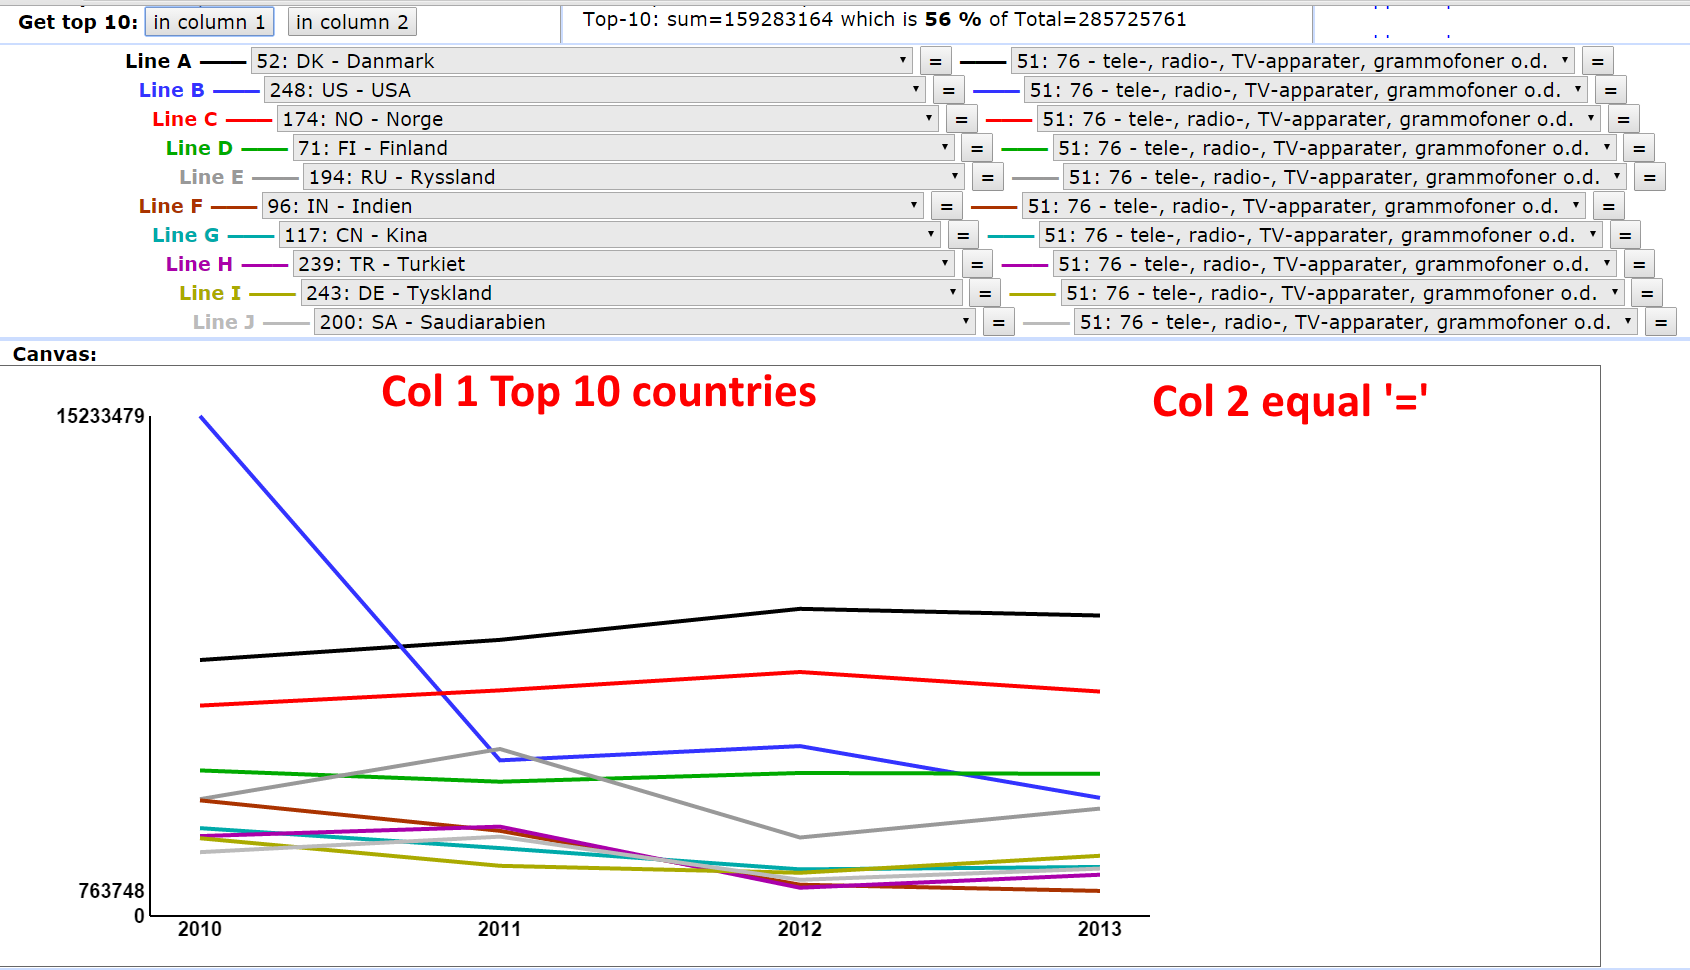
Interactive apps are especially interesting for large datasets, like export/import data.
- Many countries (266), many commodities (66 for SITC 2-digit).
<button onclick="getTopSeries(1);">in column 1</button>
<button onclick="setEqual('sel1A');" > = </button> etc.1B, 2A,2B,...
In JS:
function setEqual( selxZ ) - to set select equal.
function getTopSeries(icol) - to find top 10
Usage: Set one column equal, and get Top 10 for the other.
(one SITC + top10 countries, or one country + top10 commodities)